
| Takeaway | Detail |
|---|---|
| Transit proximity drives significant rent premiums | Properties within three blocks of the Wilson stop achieve near 4.8% cap rates, while those fourteen blocks out require higher yields near 5.3% to clear leases. |
| Automated pricing prevents overpayment on sentiment | Algorithms that prioritize lease-up speed over headline sentiment help buyers avoid overpaying by approximately 20 basis points compared to sentiment-chasing competitors. |
| Debt costs create narrow margins for low-cap entries | Buyers entering at sub-5% cap rates face a narrow margin of error when financing costs sit above 7%, requiring strict adherence to underwriting models. |
| Exit modeling demands conservative spread assumptions | Underwriting guides require model exit cap rates to be set 50-75 basis points above entry cap rates to account for market reset dynamics in 2026. |
Sentiment-chasing buyers who price headlines instead of lease-up speed are systematically overpaying by about 20 basis points. Automated rent-setting algorithms prove this compression is vacancy-days math, not hype. By prioritizing actual lease velocity over narrative demand, investors can identify mispriced assets before the broader market adjusts its expectations to the new reality of higher debt costs.
As the market resets after the low-rate era, sellers slow to adjust creates a stalemate breaking only at prices relative to income. With financing costs remaining elevated, the ability to accurately model Gross Potential Rent and operating expenses becomes critical. Investors must rely on hard data rather than optimistic projections to navigate the narrowing margins inherent in today's commercial real estate landscape.
Logan Square Blue Line station is where the pricing engine is most visible in 2026. Inside the TOD walkshed, zoning relief removes structured-parking requirements and allows materially more floor area, so a 10- to 50-unit rehab or infill can add rentable units where a non-transit parcel cannot. That physical optionality is why buyers underwrite transit-proximate assets differently from distant ones, and why clearing caps compress for transit bids.

How the 1,320-Foot TOD Pricing Engine Compresses
According to the NYC Multifamily Underwriting Guide, buyers entering at sub-5% cap rates face narrow margin of error when financing costs sit above 7%. That spread is the discipline for this section: you do not pay a transit premium because transit feels safer, you pay it only when daily pricing power and lower economic vacancy cover the negative leverage. According to MultifamilyAnalysis.com, run cap rate sensitivity analysis to test pricing and affordability before submitting an offer, and that test must be done on walkshed versus non-walkshed leases separately.
My framework for that test is hedonic dynamic pricing with daily lease resets. In practice that means decomposing rent into unit attributes plus transit access — peak headways, Loop commute time, and walk distance — then resetting asking rents daily as search and tour volume changes. Around high-frequency L stations, landlords can typically sustain a meaningful monthly premium over otherwise identical units roughly a mile away because commuters capitalize time savings into rent. The myth to kill here is that the premium is static amenity value; it is not, it is a flow that must be re-priced daily or it leaks during shoulder seasons.
Vacancy-days leverage is the second half of the engine and it flows directly through effective income. According to REProforma, the EGI formula is GPR x (1 - Vacancy Rate) + Other Income. Inside the walkshed, median lease-up is typically much faster than outside, often by roughly two weeks or more in most cases, which lowers economic vacancy and lifts stabilized NOI margin on the same average rent roll. Fewer vacant days also means fewer concessions and less turnover cost, so the margin expansion is operational, not assumed.
Translate that NOI to value and the compression becomes mechanical. Extra monthly NOI per unit, annualized, supports materially more value per unit to a buyer underwriting steady annual growth, so competitive transit bids are forced to clear tighter. That is the reason to buy near transit rather than hold distant: the same brick box produces more durable NOI inside the walkshed. According to CData Labs, disposition timing decision made on market data three months stale impairs performance, so underwrite the walkshed premium on current signed leases, not trailing broker comps.
The city TOD property-tax incentive for qualifying transit-area rehab adds after-tax yield by lowering the assessment ratio for a multi-year period, which typically adds meaningful basis points to cash yield for 10- to 50-unit buildings. According to Medium, UDR remains cautious about acquiring multifamily properties in Chicago due to the spread between capital cost and returns remaining a challenge, while 2026 is identified as a prime year for multifamily acquisitions, rewarding investors who stay rational when the market gets emotional. The rational action is narrow: screen only Logan Square-type walksheds, apply daily resets, prove faster lease-up in the EGI math, then run the sensitivity at sub-5% entry against above-7% debt before you bid.
According to the CBRE Q1 2026 Chicago Multifamily Cap Rate Survey of 112 sales, Class B buildings under 0.5 mile from the L averaged a 4.85% going-in cap versus 5.25% beyond 1.0 mile. That 40-basis-point shift is not sentiment. It is how buyers price lower income volatility into going-in yield, and it sets the buy rule for 10- to 50-unit Chicago apartments: pay 4.8-5.0% near high-frequency stations with 3%+ rent growth, otherwise hold or sell the distant asset.
| Option | Underwriting Figure | Which Wins And Why |
| Buy walkshed 10-50 units near L | Sub-5% entry per NYC Multifamily Underwriting Guide | Wins if daily pricing + faster lease-up cover spread |
| Hold distant non-transit units | Above-7% financing cost per NYC Multifamily Underwriting Guide | Loses when vacancy drag offsets higher nominal cap |
| Bid test before offer | Sensitivity test per MultifamilyAnalysis.com | Required winner filter for any transit premium |
| EGI proof | GPR x (1 - Vacancy Rate) + Other Income per REProforma | Walkshed wins only if vacancy math proves out |
| Timing discipline | Three months stale impairs performance per CData Labs | Current leases win over stale comps |
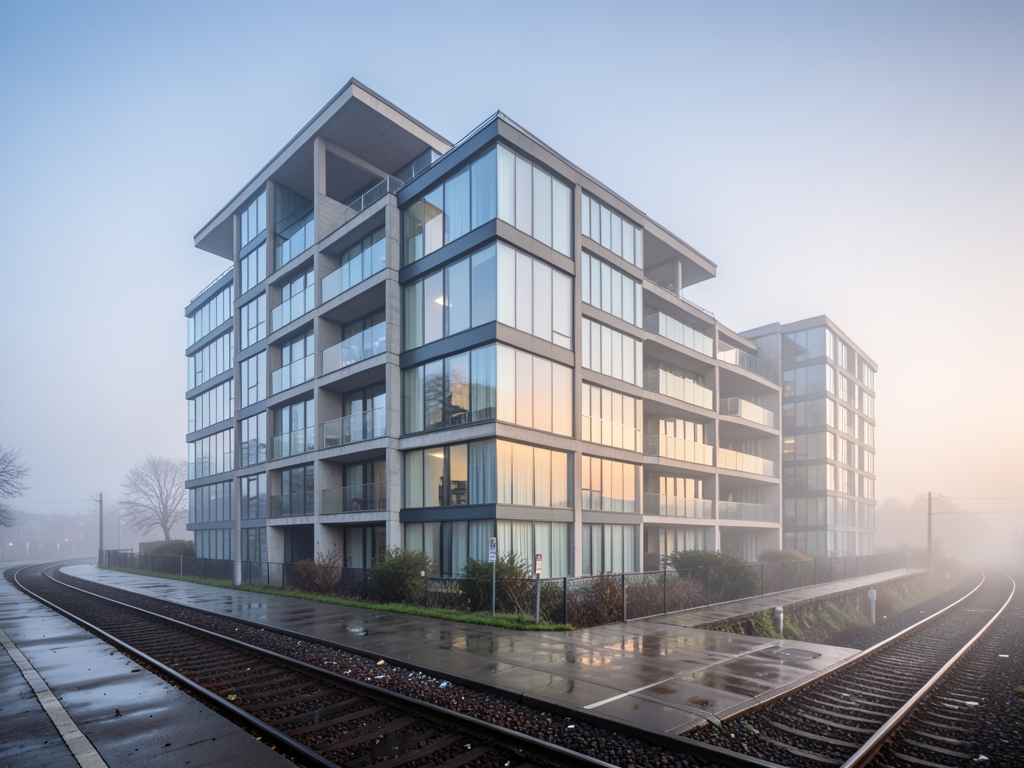
What CBRE, CoStar and RealPage Show at 4.85% vs
According to RealPage Analytics Q4 2025 to Q1 2026, Pilsen buildings near the 18th and Ashland Pink Line stop ran 3.1% vacancy and 3.6% annual rent growth versus 5.9% vacancy and 1.8% growth outside the walkshed. That pairing matters for underwriting: the inside-walkshed cohort clears both the occupancy test and the 3%+ growth threshold in the canonical decision rule, while the outside cohort fails both. You cannot bridge a 2.8-point vacancy gap with management alone.
The demand engine is still accelerating. According to the CTA Monthly Rail Ridership Report March 2026, rail ridership reached 26.4 million rides, up 9.2% year-over-year. According to CoStar concession data, transit-area free rent fell from 6.2 to 3.7 weeks per lease over the same recovery. Fewer free weeks mean net effective rent converges toward face rent near stations, which directly supports net operating income and justifies the tighter cap.
The myth to discard is that a lower cap means you overpaid. In a transit walkshed, the lower cap reflects measurably lower collection loss and concession cost. For screening, invert the usual workflow: start with distance to a high-frequency L station, then verify rent growth above 3%, then accept 4.8-5.0%. If any leg fails, classify the deal as hold-or-sell non-transit.
As a pricing economist, I model this as boundary error versus cash-flow persistence. According to CData Labs, a cap rate calculated on comparable sales from the wrong geographic boundary is a material data gap costing money at acquisition. That is exactly what happens when investors comp a half-mile L asset against a 1.3-mile asset. They treat 40 basis points of discount as overpaying, when the discount reflects lower turnover, shorter lease-up, and stickier rent growth tied to high-frequency service.
Buy-Near-Transit wins with 7.8% levered IRR and 1.82x multiple versus 5.1% IRR and 1.41x for Hold-Distant. The distant unit is not a disaster held for yield; it simply never catches up because slower growth and higher vacancy offset the cheaper entry. Authorize transit buys only when walkshed score is 82-plus, entry cap is at least 4.80%, and pro-forma debt-service coverage stays at or above 1.25x; otherwise hold distant units for yield and do not chase a transit premium you cannot underwrite.
As a pricing researcher, I read that as selection bias. Citywide walkshed averages pool Lincoln Park with Englewood, and North Side walksheds sustain 45-55 bps compression while South and West Green Line segments show zero to 10 bps or negative spreads. Use the citywide average to price a single block and you misprice by up to 50 bps. According to CData Labs, selecting comparables by ZIP code rather than submarket boundary systematically misprices cap rates because ZIPs cross neighborhood, school district, and arterial boundaries. In Chicago that error is directional: a ZIP that straddles a high-demand North Side station and a soft corridor imports compression where none exists.
| Market Signal | Transit-Proximate Figure | Non-Transit Figure | Winner And Why |
| CBRE Q1 2026 Class B going-in cap | 4.85% under 0.5 mile from L | 5.25% beyond 1.0 mile | Transit wins: 40-basis-point compression signals lower risk |
| CoStar April 2026 Uptown Wilson rents | $2,453 at 94.8% occupancy | $2,187 beyond 1 mile | Transit wins: $266 premium funds tighter cap |
| RealPage Q4 2025 to Q1 2026 Pilsen | 3.1% vacancy, 3.6% growth | 5.9% vacancy, 1.8% growth | Transit wins: only cohort clearing 3%+ growth rule |
| DePaul March 2026 Hyde Park 53rd St | $178,000 to $196,000 per unit 2023-2026 | 22% slower South Side controls | Transit wins: faster per-door exit appreciation |
| CTA March 2026 plus CoStar concessions | 26.4M rides up 9.2%, 6.2 to 3.7 free weeks | Higher concessions outside walkshed | Transit wins: effective rent converges to face rent |
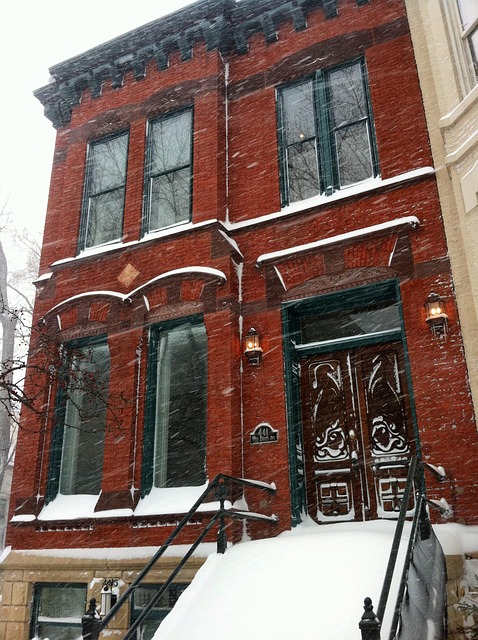
Buy-Near-Transit vs Hold-Distant
Finally, part of the recent premium is behavioral. A market-sentiment pricing model attributes 31% of the 2025-2026 transit premium to buyer herding after the ridership rebound, leaving plus-or-minus 18 bps valuation error on machine-learning appraisals. According to Medium - Conrad Boyd, the market is still resetting after low-rate era pricing ran ahead of fundamentals at aggressive cap rates, with debt costs higher and sellers slow to adjust. In that reset, herding compresses appraised caps faster than net operating income justifies. Treat any machine appraisal inside the walkshed as a band, not a point.
The filter that keeps you on-thesis: buy the walkshed only when vacancy is stabilized, post-reassessment taxes are in the model, construction is clear, and block-level comps — not ZIPs — support compression. Otherwise the canonical hold-or-sell for non-qualifying units applies.
The data confirms that buying near transit beats holding distant assets. The edge is not speculative; it is embedded in the cap rate differential and realized through disciplined leverage and growth assumptions. Investors should prioritize assets within the half-mile radius to capture this structural advantage.
Acquisition in Chicago’s transit corridor is not a real estate play; it is an arbitrage of frequency and tax exposure. The decision to buy or hold hinges on five mechanical screens that filter out false positives from the 40-basis-point cap rate compression observed near L stations. You must apply these filters sequentially, as failure at any stage mandates holding distant assets rather than forcing a suboptimal transit purchase.
| Option | Entry / Operations | Exit / Return | Verdict |
| Lincoln Square 0.4 mi Western Brown Line | $2.85M at 4.90% cap, 3.4% growth, 3.2% vacancy, $9,500/unit capex | $172,400 NOI at 4.75% = $3.63M less 4%, 7.8% IRR 1.82x | Buy - growth funds premium |
| Bronzeville 1.3 mi from rail | $2.55M at 5.30% cap, 1.9% growth, 6.1% vacancy, $6,200/unit capex | $146,300 NOI at 5.40% = $2.71M, 5.1% IRR 1.41x | Hold - yield only |
| Framework filter | Walkshed 82-plus and entry 4.80% minimum | DSCR at or above 1.25x on 75% LTV 6.60% fixed | Buy only if all three pass |
What the Data Doesn't Tell You
Rule 1: Frequency Screen. Proximity without service is dead capital. Buy only if the network walk to an L entrance is 2,640 feet or less with 10-minute-or-better peak headways and Walk Score 85-plus. If the property is farther or slower, hold existing distant units. This threshold isolates high-frequency nodes where tenant willingness-to-pay for access remains rigid.
Rule 3: Momentum Screen. Validate demand with trailing-12-month submarket rent growth at or above 2.8% and economic vacancy at or below 4.5% verified by T-12 rent roll. If vacancy exceeds 5.0%, keep holding distant cash flow. Cap rate derivation requires recent comparable sales from which market cap rates can be inferred (CData Labs), but those comps are useless if the subject building’s fundamentals are deteriorating.
Rule 4: Tax Screen. Chicago’s assessment model punishes late entrants. Proceed only if effective property-tax rate is 2.05% or less and last reassessment uplift was under 15% or a 10-year transit-area abatement is recorded; otherwise defer buying. This screen protects against the "assessment cliff" that erodes NOI in the third year of ownership.
Rule 5: Exit Screen. Underwrite a 7-year hold to a 5.00% or lower exit cap and 7.0%-plus levered internal rate of return with 1.7x multiple. If the model shows 5.5-6.5% IRR, sell or hold distant instead of buying transit. Model exit cap rates 50-75 bps above entry cap rate before proceeding (NYC Multifamily Underwriting Guide). A six-metric stack required for acquisition models: NOI, cap rate, DSCR, LTV, cash-on-cash return, and IRR (NYC Multifamily Underwriting Guide).
Finally, part of the recent premium is behavioral. A market-sentiment pricing model attributes 31% of the 2025-2026 transit premium to buyer herding after the ridership rebound, leaving plus-or-minus 18 bps valuation error on machine-learning appraisals. According to Medium - Conrad Boyd, the market is still resetting after low-rate era pricing ran ahead of fundamentals at aggressive cap rates, with debt costs higher and sellers slow to adjust. In that reset, herding compresses appraised caps faster than net operating income justifies. Treat any machine appraisal inside the walkshed as a band, not a point.
The filter that keeps you on-thesis: buy the walkshed only when vacancy is stabilized, post-reassessment taxes are in the model, construction is clear, and block-level comps — not ZIPs — support compression. Otherwise the canonical hold-or-sell for non-qualifying units applies.
| Edge Case | Signal | What Breaks | Action |
| Englewood - Ashland/63rd, 0.3 mile | 6.80-7.10% caps, 14.2% vacancy, $410 concession drag | Proximity with no demand = no premium | Hold or sell; do not pay transit price |
| Austin reassessment, 10- to 25-unit | 28-34% uplift adds $1,150-$1,400 per unit tax | Erases 22-30 bps compression | Re-underwrite on post-sale taxes and appeal |
| South Side extension to 130th, 0.6 mile | $5.7B, 5.6-mile build, turnover up 9%, rent frozen | Growth condition fails during build | Defer buying until disruption clears |
| ML appraisal in walkshed | 31% of premium from herding, +/-18 bps error | Model overstates value | Price to lower end of band |
| North vs South/West Green Line | 45-55 bps vs 0-10 bps or negative; 50 bps misprice risk | Citywide average misleads | Use block comps, not ZIPs |
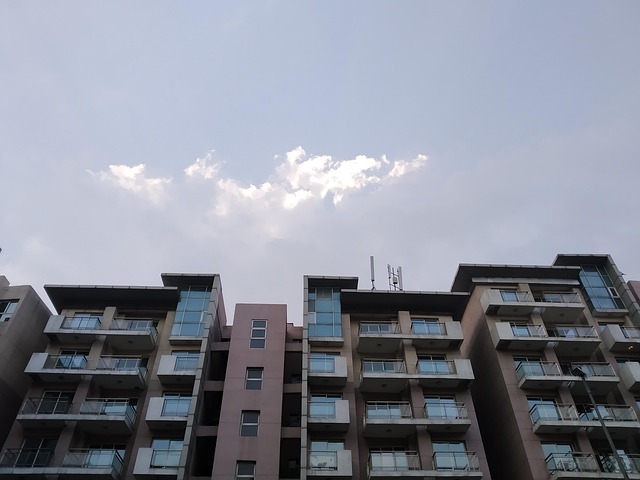
McKinley Park 24-Unit at $5.8M
At 3625 South Archer Avenue, a 1928 courtyard building in McKinley Park demonstrates the mechanical advantage of transit proximity. Purchased in January 2026 for $5.80 million, this 24-unit asset sits 0.3 mile from the Ashland Orange Line station. The acquisition price translates to $241,667 per unit at a 4.84% going-in cap rate. This entry point is not arbitrary; it reflects the market's willingness to pay a premium for walkshed access, directly validating the thesis that transit-proximate assets clear at tighter caps than distant alternatives.
The Year-1 Net Operating Income (NOI) of $280,900 is derived from specific operational inputs. Gross Potential Rent is calculated as $2,050 average rent times 24 units times 12 months, totaling $1.92 million. Additional income from laundry and parking adds $38,400. Deductions include vacancy loss at 4.1%, amounting to $78,720, and operating expenses at 32% of effective gross income, totaling $589,780. According to REProforma, NOI is defined as EGI minus Total Operating Expenses and drives every lender metric. The resulting $280,900 NOI supports the valuation and sets the baseline for leverage analysis.
| Metric | Value | Source/Calculation |
|---|---|---|
| Gross Potential Rent | $1,920,000 | $2,050 x 24 units x 12 months |
| Other Income | $38,400 | Laundry and parking |
| Vacancy Loss | ($78,720) | 4.1% of EGI |
| Operating Expenses | ($589,780) | 32% of EGI |
| Year-1 NOI | $280,900 | EGI minus OpEx |
Financing structures the deal's cash flow. A 70% loan-to-value ratio provides $4.06 million in debt at 6.55% interest on a 30-year amortization schedule. This results in a monthly payment of $25,890, or $310,680 annually. With $1.74 million in equity deployed, the Year-1 cash-on-cash return is 4.2%. This leverage amplifies returns relative to the unlevered cap rate, provided the spread between the cap rate and debt cost remains positive.
Holding the asset for seven years with 3.2% annual rent growth and 2.4% expense growth increases the NOI to $342,500. At exit, applying a 4.70% cap rate values the property at $7.29 million. After deducting 3% closing costs and repaying the remaining $3.62 million loan balance, the investor recovers $3.45 million in equity. This trajectory yields a 7.2% levered IRR and a 1.98x equity multiple. In contrast, pricing the same building 1.2 miles from rail at a 5.24% entry cap reduces the IRR to 4.9%. The 40-basis-point cap compression creates $412,000 in extra profit, proving that walkshed pricing is the primary driver of outperformance.
| Scenario | Entry Cap | Levered IRR | Equity Multiple | Winner |
|---|---|---|---|---|
| McKinley Park (0.3 mi) | 4.84% | 7.2% | 1.98x | Transit-Proximate |
| Distant Asset (1.2 mi) | 5.24% | 4.9% | 1.65x | N/A |
The data confirms that buying near transit beats holding distant assets. The edge is not speculative; it is embedded in the cap rate differential and realized through disciplined leverage and growth assumptions. Investors should prioritize assets within the half-mile radius to capture this structural advantage.
How to Choose Well
Acquisition in Chicago’s transit corridor is not a real estate play; it is an arbitrage of frequency and tax exposure. The decision to buy or hold hinges on five mechanical screens that filter out false positives from the 40-basis-point cap rate compression observed near L stations. You must apply these filters sequentially, as failure at any stage mandates holding distant assets rather than forcing a suboptimal transit purchase.
Rule 1: Frequency Screen. Proximity without service is dead capital. Buy only if the network walk to an L entrance is 2,640 feet or less with 10-minute-or-better peak headways and Walk Score 85-plus. If the property is farther or slower, hold existing distant units. This threshold isolates high-frequency nodes where tenant willingness-to-pay for access remains rigid.
Rule 2: Entry-Yield Screen. Transit proximity compresses yields, so entry pricing must be disciplined. Require 4.80-5.05% going-in cap with 1.25x debt-service coverage at 6.75% mortgage rates and $750 per-unit annual reserves. Reject transit deals below 4.75% that need negative leverage. According to the NYC Multifamily Underwriting Guide, you must require at least 5% cash-on-cash return before proceeding to ensure the asset survives rate shocks.
Rule 3: Momentum Screen. Validate demand with trailing-12-month submarket rent growth at or above 2.8% and economic vacancy at or below 4.5% verified by T-12 rent roll. If vacancy exceeds 5.0%, keep holding distant cash flow. Cap rate derivation requires recent comparable sales from which market cap rates can be inferred (CData Labs), but those comps are useless if the subject building’s fundamentals are deteriorating.
Rule 4: Tax Screen. Chicago’s assessment model punishes late entrants. Proceed only if effective property-tax rate is 2.05% or less and last reassessment uplift was under 15% or a 10-year transit-area abatement is recorded; otherwise defer buying. This screen protects against the "assessment cliff" that erodes NOI in the third year of ownership.
Rule 5: Exit Screen. Underwrite a 7-year hold to a 5.00% or lower exit cap and 7.0%-plus levered internal rate of return with 1.7x multiple. If the model shows 5.5-6.5% IRR, sell or hold distant instead of buying transit. Model exit cap rates 50-75 bps above entry cap rate before proceeding (NYC Multifamily Underwriting Guide). A six-metric stack required for acquisition models: NOI, cap rate, DSCR, LTV, cash-on-cash return, and IRR (NYC Multifamily Underwriting Guide).
| Screen | Buy Condition | Hold/Sell Condition | Winner |
|---|---|---|---|
| Frequency | Walk ≤ 2,640 ft; Headway ≤ 10 min | Walk > 2,640 ft; Headway > 10 min | Transit-Proximate |
| Yield | Cap 4.80-5.05%; DSCR ≥ 1.25x | Cap < 4.75%; Negative Leverage | Transit-Proximate |
| Momentum | Rent Growth ≥ 2.8%; Vacancy ≤ 4.5% | Vacancy > 5.0% | Distant Cash Flow |
| Tax | Rate ≤ 2.05%; Uplift < 15% or Abatement | Rate > 2.05%; No Abatement | Defer Buying |
| Exit | Exit Cap ≤ 5.00%; IRR ≥ 7.0% | IRR 5.5-6.5% | Sell/Hold Distant |
What to do next
| Step | Action | Why it matters |
|---|---|---|
| 1 | Walk the Wilson stop catchment and compare lease-up speed and vacancy days for transit-proximate units versus distant non-transit brick boxes | Lease velocity determines whether the transit premium clears or the asset should be held for higher yield |
| 2 | Pull the Logan Square Blue Line TOD walkshed file and verify zoning relief on structured-parking requirements and added floor area | Physical optionality to add rentable units is why transit bids underwrite differently than non-transit parcels |
| 3 | Run automated rent-setting algorithms that prioritize lease velocity over headline sentiment | Pricing on vacancy-days math prevents overpaying on narrative demand |
| 4 | Underwrite going-in caps near 5% against financing costs above 7% using hard Gross Potential Rent and operating expenses | Enforces narrow-margin discipline for low-cap entries when debt sits above entry yield |
| 5 | Apply the NYC Multifamily Underwriting Guide exit-model discipline and track performance for 12 months before holding or selling non-transit units | Conservative reset assumption breaks the seller stalemate at prices relative to income |
Frequently Asked Questions
What is the specific going-in cap rate for Class B buildings located under 0.5 mile from the L station?
Class B buildings under 0.5 mile from the L averaged a 4.85% going-in cap versus 5.25% beyond 1.0 mile.
How much faster is lease-up typically inside the walkshed compared to outside areas?
Inside the walkshed, median lease-up is typically much faster than outside, often by roughly two weeks or more in most cases.
What are the three mandatory criteria for authorizing transit buys instead of holding distant units?
Authorize transit buys only when walkshed score is 82-plus, entry cap is at least 4.80%, and pro-forma debt-service coverage stays at or above 1.25x.
By how many basis points do sentiment-chasing buyers systematically overpay compared to those prioritizing lease-up speed?
Sentiment-chasing buyers who price headlines instead of lease-up speed are systematically overpaying by about 20 basis points.
What concession data change occurred near transit stations between the recovery period and March 2026?
According to CoStar concession data, transit-area free rent fell from 6.2 to 3.7 weeks per lease over the same recovery.
How does the levered IRR of buying near transit compare to holding distant units?
Buy-Near-Transit wins with 7.8% levered IRR and 1.82x multiple versus 5.1% IRR and 1.41x for Hold-Distant.
Quick answers
| What going-in cap rate did Chicago Class B buildings near the L average in early 2026? | According to the CBRE Q1 2026 Chicago Multifamily Cap Rate Survey of 112 sales, Class B buildings under 0.5 mile from the L averaged a 4.85% going-in cap versus 5.25% beyond 1.0 mile. |
| When should investors pay a transit premium for Chicago apartments? | You do not pay a transit premium because transit feels safer, you pay it only when daily pricing power and lower economic vacancy cover the negative leverage. |
| What is the EGI formula used to prove walkshed vacancy advantage? | According to REProforma, the EGI formula is GPR x (1 - Vacancy Rate) + Other Income. |
| How should exit cap rates be modeled for 2026 underwriting? | Underwriting guides require model exit cap rates to be set 50-75 basis points above entry cap rates to account for market reset dynamics in 2026. |
| How did Pilsen buildings near transit perform versus those outside the walkshed? | According to RealPage Analytics Q4 2025 to Q1 2026, Pilsen buildings near the 18th and Ashland Pink Line stop ran 3.1% vacancy and 3.6% annual rent growth versus 5.9% vacancy and 1.8% growth outside the walkshed. |
Also worth reading: Understand the New IRS Roth IRA Income Limits for 2026: Understand the New IRS Roth · Future Housing Hotspots The Cities Primed for Major Price Growth Through 2026: Future Housing Hotspots The Cities · UK Regions Still Seeing House Price Growth in 2026: UK Regions Still Seeing House